Ting Zhang1, Juan P. Wachs1, Bradley S. Duerstock1,2
1School of Industrial Engineering, 2Weldon School of Biomedical Engineering, Purdue University, West Lafayette, IN 47907 USA
INTRODUCTION
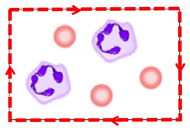
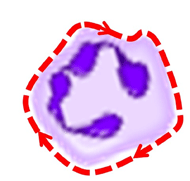
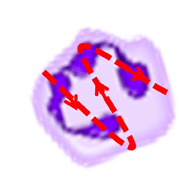
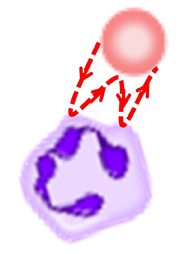
The blind community often encounters substantial challenges when exploring images including 2D images displayed over media such as tactile paper printouts and 3D printed representations. Unlike 3D spatial navigation of indoor or outdoor environments [1], there is not much work in assistive strategies development to automatically assist users during 2D image exploration. Image exploration for people who are blind or visually impaired (BVI) is a challenging task taking more time than visual perception and often requiring human assistance [2, 3]. The goal of our research is to increase the efficiency of exploring images non-visually as well as enabling them to do so independently through the use of a computer-supported image exploration system. Computer-supported image exploration systems track user behaviors and provides guidance or exploration tips based on the current user status [4]. This paper focuses on understanding the goals behind different user behaviors to facilitate the design of assisting strategies for image exploration. The image exploratory behaviors, referred to as exploration procedures (EPs), were previously described in Zhang et al. [5] are summarized in Table 1.
Exploration Procedure |
Frame Following (FF) |
Contour Following (CF) |
Surface Sweeping (SS) |
Relative Positioning (RP) |
Absolute Positioning (AP) |
|---|---|---|---|---|---|
| Description | Trace the boundary of the image to obtain the image size. | Trace the boundary of objects on the image to learn the size and shape of objects. | Back-and-forth movement inside objects to learn the feature of objects. | Back-and-forth movements between objects to obtain their relative locations. | Back-and-forth movements between objects and the image boundary to obtain their absolute locations on the image. |
| Visualization | |
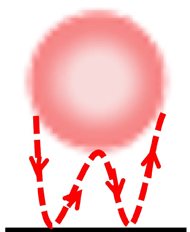
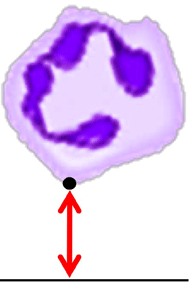
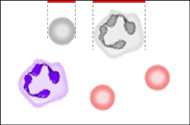
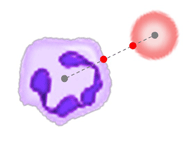
For example, people who are BVI use procedure AP (absolute positioning shown in Table 1Table 3.1) to measure the distance between an object and the image boundary. With haptic-based interaction users feel resistance at the locations of interest. Unlike vision, haptic-based interaction estimates distance by the elapse of time from the moment the user departs from a location on the image till the user reach a different location [6]. Due to the inability to gauge distance quickly users often perform this procedure several times. The procedure is repetitively conducted between an object within the image and the image boundary. To make this process faster, proper assistance can provide users the shortest path between the object and the image boundary, thus reducing the frequency of performing this task to improve the goal of location assessment.
In this paper, a “think-out-loud” experiment was conducted to understand the users’ reasons for performing each exploration procedure [7]. Assisting strategies were then developed based on the observations from the experiment. The experimental results and the findings about the designed strategies would serve as the fundamental basis for the development of intelligent assisting interfaces.
METHOD
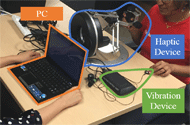
When individuals who are blind explore images, their two main goals for understanding image content are to discriminate what objects are on the image and where these objects are located relative to each other and within the whole picture. These two goals can be formally defined as - identifying objects and locating objects. To understand the relationship between performing each exploration procedure and the ultimate goal of understanding the image, experiments were conducted with users doing a think-out-loud image analysis, requiring users to explain why they were performing a certain exploration procedure using our multimodal image perception system [3] while they were actively exploring parts of the image.
Experiment setup
Subjects
Six blindfolded participants were recruited for this experiment, including 3 females and 3 males, with ages ranging from 20 to 30.
Materials
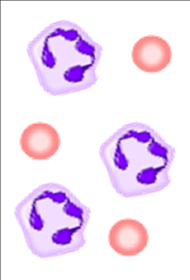
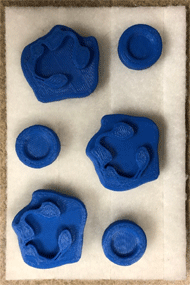
Six different blood smear images were used as testing images. 3D printed blood cells were provided for the participants to replicate their mental representation of the blood smear images. Figure 2 shows an example of a test image and its replicated version.Procedure
Participants were blindfolded during the whole experiment. To be familiar with the haptic-based image perception system they were first asked to perform a training session using the interface. After the participants completed the training session, they were asked to explore a blood smear image using the system and replicate the image using 3D printed blood cell models. While they were exploring the image, the subjects would explain the reason behind their actions.
RESULTS
The two major goals for image exploration were object identification and localization. It was observed from the experiments that the two major goals were further broken into specific tasks. For example, users identified an object within the image (i.e. different blood cells) by measuring its shape, size and texture. “Contour following” was applied to understand the shape and size, while “surface sweeping” was used to perceive the texture. Therefore, two final goals were broken into smaller goals, that are defined as intermediate goals and summarized in Table 2.
| EP | Goals |
|---|---|
| FF |
|
| CF |
|
| SS |
|
| RP |
|
| AP |
|
Frequency of goals
From Table 2, we can observe that participants used the same EP for different goals. For example, there are three goals for CF. Besides understanding the shape and size of an object, CF was also performed to locate the compass points on an object or locate the explored neighbors. The compass points of an object are defined as the most outreached positions on its boundary in the four directions, North, South, East, and West. While the neighbors of an object are the objects surrounding it.
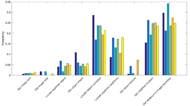
Among these goals, some were pursued frequently, while others were less frequent. A normalized histogram (Figure 3) was computed to show the frequency of each goal during the exploration of one image. In Figure 3, each colored bars represents the data of one subject.
Figure 3. Normalized histograms of goals for image exploration.
To identify if the distribution of goals was commonly pursued among the different users, a Bhattacharyya coefficient was calculated to measure the similarities between the histograms. In equation (1), P and Q are two histograms with n partitions. pi and qi are the frequencies of the ith partition in P and Q. The Bhattacharyya coefficient of P and Q equals the summation of square roots of pi times qi with i ranges from 1 to n.
(1) |
Using equation (1), the data collected shows a coefficient of 0.954 among 6 participants, indicating a shared behavior among users.
DISCUSSION
In order to develop an autonomous computer-supported image exploration system, it is necessary to be able to automatically recognize and track users’ EPs and to understand which EPs are most critical for understanding image content. A spiking neural network framework was previously developed to automatically recognize and classify EPs being performed [5]. In this paper certain EPs were performed in greater frequency by users in order to better understand image content. Intelligent assisting strategies can be designed to specifically help accomplishing those image understanding goals that are more challenging to accomplish.
Potential assisting strategies for most frequently performed goals
It was observed from Figure 3 that the top three goals were “get distance to image boundary”, “get neighbor location” and “locate object compass”. Based on these results, two assisting strategies were designed:
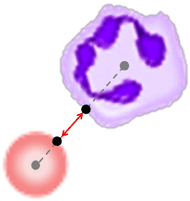
1. Shortcut: Addressing the goals “get neighbor location” and “get distance to image boundary”, strategy “Shortcut” is developed to facilitate the measurement of distance and direction between an object and its surroundings. Goal “get neighbor location” is related with exploration procedure RP. When RP is detected, the path connecting the centers of the two objects is calculated and provided to the users. The goal “get distance to image boundary” is associated with procedure AP. Therefore, when AP is detected, the shortest path between an object and the related image boundary is provided to expedite the determination of distance. The shortest path between an object and an image boundary is defined as the projected line from the compass points to the image boundaries.
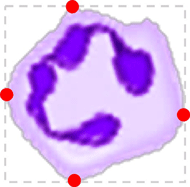
2. Compass: Users frequently locate the compass points of an object using procedure contour following (CF), so that they can move from these points to measure its relations with the surroundings. The “Compass” strategy is designed to facilitate this procedure. The locations of an object’s compass points are provided when CF is detected.
Potential Assisting strategies for memorization-related goals
Another observation from this study is that users are required to memorize or create a detailed mental picture while exploring images. “Locate explored objects” and “Locate explored neighbors” were the two goals that requires the most memorization. To alleviate the requirement on memory/cognitive load, two other assisting strategies were designed:
1. Projection: “Locate explored objects” is the most popular goal associated with performing exploration procedure FF. The “Projection” strategy indicates to the user the projected position of nearest explored objects when the user is moving along the image boundary.
2. Neighbor: Another assisting strategy is “Neighbor”, which helps decrease memory load by automatically indicating the locations of explored neighbors when the user is doing CF. The pair of correspondence points obtained from strategy “Shortcut” is used to indicate the approximate locations of explored neighbors.
Table 3 summarizes the assisting strategies discussed with the related exploration procedures and visualizations.
| Assisting Strategy | Shortcut | Compass | Projection | Neighbor | |
|---|---|---|---|---|---|
| Description | Calculates the shortest path between the object and
|
Indicates the locations of the compass points. | Projects the location of the objects onto the image boundaries. | Indicates the locations of explored neighbors. | |
| Related EP | Relative/Absolute Positioning | Contour Following | Frame Following | Contour Following | |
Visualization |
|||||
CONCLUSIONS
In this paper, we investigated the underlying reasons or goals of performing exploration procedures by individuals who are BVI. Understanding these goals are critical in designing appropriate assisting strategies for image exploration. The results show that different users shared common behaviors as well as reasoning behind their behaviors when using our haptic-based image perception system. Multiple assisting strategies were proposed in this work and will be validated in future work. The findings from this study will serve as the fundamental block for the development of an intelligent assisting interface to facilitate image exploration of users who are BVI.
REFERENCES
[1] O. Lahav, H. Gedalevitz, S. Battersby, D. Brown, L. Evett, and P. Merritt, “Virtual environment navigation with look-around mode to explore new real spaces by people who are blind,” Disabil. Rehabil., vol. 40, no. 9, pp. 1072–1084, Apr. 2018.
[2] J. Lee, Y. Kim, and G. J. Kim, “Effects of Visual Feedback on Out-of-Body Illusory Tactile Sensation When Interacting With Augmented Virtual Objects,” IEEE Trans. Human-Machine Syst., pp. 1–12, 2016.
[3] T. Zhang, B. S. Duerstock, and J. P. Wachs, “Multimodal Perception of Histological Images for Persons Who Are Blind or Visually Impaired,” ACM Trans. Access. Comput., vol. 9, no. 3, pp. 1–27, Jan. 2017.
[4] R. Nkambou, J. Bourdeau, and V. Psyché, “Building intelligent tutoring systems: An overview,” Stud. Comput. Intell., vol. 308, no. 4, pp. 361–375, Dec. 2010.
[5] T. Zhang, T. Zhou, B. S. Duerstock, and J. P. Wachs, “Image Exploration Procedure Classification with Spike-timing Neural Network for the Blind,” in 2018 24th International Conference on Pattern Recognition (ICPR), 2018, pp. 3256–3261.
[6] Y. Hatwell, A. Streri, and E. Gentaz, Touching for knowing : cognitive psychology of haptic manual perception. John Benjamins Pub, 2003.
[7] LEWIS and C., “Using the ‘thinking-aloud’ method in cognitive interface design,” Res. Rep. RC9265, IBM T. J. Watson Res. Cent., 1982.