VARIABILITY AND COMPLEXITY OF SHOULDER MOTION DURING WHEELCHAIR PROPULSION
Iris M.-K. Hsua, Chandrasekaran Jayaramanb, Shawna Culpc, Ian M. Ricec, Elizabeth T. Hsiao-Weckslera, Jacob J. Sosnoffc.
aDepartment of Mechanical Science and Engineering, University of Illinois at Urbana-Champaign, Urbana, IL;
bDepartment of Industrial and Enterprise Systems Engineering, University of Illinois at Urbana-Champaign, Urbana, IL;
cDepartment of Kinesiology and Community Health, University of Illinois at Urbana-Champaign, Urbana, IL.
ABSTRACT
Researchers have quantified shoulder motion during manual wheelchair propulsion using basic kinematics, such as peak joint angle and velocity. Yet, little has been done to examine the variability of upper body motion patterns during wheelchair propulsion, even though studies have suggested that lack of variability in biological systems maybe indicative of pathology. Phase portraits, which are graphical representations of position relative to velocity, can be used to explore the dynamics of a system over multiple cycles. Recently, new techniques have been developed to examine changes in variability and complexity in the shape of phase portraits. Variability was quantified by examining fluctuations of the centroid of each phase portrait over multiple cycles, specifically by calculating the confidence area and drift of the centroid. Complexity of the portrait was quantified by determining the portrait shape’s frequency content using Fourier-based methods. In this preliminary study, phase portraits of shoulder flexion-extension angular position versus angular velocity were examined as function of propulsion speed. Nine experienced manual wheelchair users propelled on a stationary roller at fast (1.1 m/s) and slow (0.7 m/s) speeds for three minutes at each speed. Variability parameters had mixed results with propulsion speed. There was a trend for the centroid area to increase with speed (p = 0.06); whereas, there was no significant change in centroid drift (p = 0.2). Complexity of the phase portrait shape decreased significantly with speed (p < 0.05). These results support prior work that propulsion speed impacts shoulder biomechanics. Future work needs to determine if variability and complexity metrics are sensitive to pathology.
KEYWORDS
Wheelchair propulsion mechanics, variability, complexity, phase portraits.
INTRODUCTION
Examination of wheelchair propulsion has focused on characterizing the average kinematics and kinetics of the upper limb. This research has led to important insights into wheelchair propulsion and advanced the field of wheelchair design, fitting, and propulsion training (Cooper et al., 2010). Despite the importance of this research, it has for the most part ignored variability and the complexity of the propulsion mechanics.
Traditionally, variability in biological systems was regarded as noise and was often neglected in research studies. However, in recent decades, research has documented the association between variability and complexity of physiological output and pathologies (Davids et al., 2005; Goldberger et al., 2002). This research suggests that variability and complexity of physiological output in of themselves are an important metrics of study. This theoretical framework views variability as the magnitude of fluctuations of physiological output as a function of time. In contrast, complexity refers to the time evolving structure of physiological output (Newell et al., 2006).
There is growing evidence that variability and complexity of movement are related to dysfunction such as low back pain (Seay et al., 2011) and knee injury (Hamill et al., 1999). This body of work raises the possibility that variability and complexity of wheelchair propulsion could be related to conditions such as upper extremity pain. Prior to determining whether variability and complexity of wheelchair propulsion are related to dysfunction, the appropriate metrics to quantify variability and complexity need to be established.
There are numerous methods to quantify variability and complexity of movement (Sterigou, 2004; Davids et al., 2005). Recently, a technique of quantifying variability and complexity using phase portraits has been developed (DiBerardino et al., 2010).
The goal of the current study was to examine the outcome of this technique in wheelchair propulsion. Shoulder kinematics in the plane of elevation were presented in phase portraits and changes in inter-cycle and intra-cycle fluctuation through variability and complexity measures were examined relative to propulsion speed.
METHODS
Data collection
Nine participants (five females, four males, age=21.8±3.3 yrs) from the local community were recruited for this study and gave informed consent. All were manual wheelchair users, who used a wheelchair for more than a year as the primary means of ambulation. Injury diagnosis includes spinal cord injury (n=6), spina bifida (n=1), cerebral palsy (n=1) and osteogenesis imperfect (n=1).
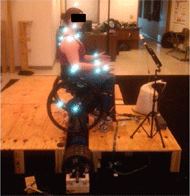 Figure 1: Experimental set up. Participant is in initial calibration position. d
Each participant’s wheelchair was bilaterally fitted with force and moment sensing wheels (SmartWheel; Three Rivers Holdings LLC; Mesa, AZ, USA) and placed on a stationary roller with a tie-down system. The participants were asked to propel at constant speeds of 1.1 m/s (4.0 km/h, fast) or 0.7 m/s (2.5 km/h, slow) for three minutes. These speeds were chosen based on pilot testing using the setup. The sequence of speeds was randomized for each subject. Before the trial began, the subject was asked to push at the designated speed and get accustomed to the speed and experimental set up. A speedometer was used to provide real-time feedback to the participant. At the end of each trial, participants were asked to rate their level of perceived exertion (RPE) on the Borg scale (6-20) (Borg, 1998). Twenty-two reflective markers were places on bony landmarks and the SmartWheel axles to define the trunk, upper arm, forearm, hand, as well as the position of the wheelchair and wheels (Fig. 1). The kinematic data were collected using motion capture equipment (Cortex 2.5, Motion Analysis Co.; Santa Rosa, CA, USA) at 100Hz. Kinetic data were collected simultaneously at 100Hz.
Data reduction
For this preliminary study, kinematic data of the left arm were analyzed. Kinematic data were filtered with a 4th order recursive Butterworth filter at 15Hz cutoff frequency. Kinetic data were collected via the SmartWheels to define push cycles. The start of a push cycle was defined as when hand rim moment was greater than 0.8Nm for more than 15 frames (0.15s). Twenty cycles (51st to 70th cycle) were investigated in this study. Shoulder kinematics were computed based on the ISB recommendation of rotation sequence Y-X-Y (Wu et al., 2005). All calculations were performed using custom MATLAB programs (R2011b, The MathWorks; Natick, MA, USA).
Data analysis
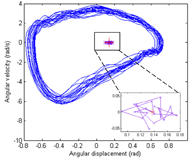 Figure 2: A phase portrait of the shoulder flexion-extension angle of 20 cycles from a representative subject at fast speed. Solid blue line in the plot denotes the phase portrait. ‘x’ denotes centroid of each cycle, ‘+’ represents the average centroid across 20 cycles, (Inset plot in the lower right hand corner: zoomed-in view of the centroids.) d
A phase portrait is a graphical representation of angular position against angular velocity and can express cyclic dynamics of the data. In contrast to the tradition of reporting average kinematics of multiple cycles in time-series format, phase portraits show characteristics across multiple cycles (DiBerardino, 2010). Phase portraits are an accepted form of kinematics data presentation and have been used to describe motion pattern differences (Stergiou, 2004). In particular, phase portraits can illustrate inter- and intra-cycle fluctuation. Phase portraits of shoulder flexion-extension relative to the trunk were produced and further analyzed for variability and complexity (Fig. 2).
Variability of phase portrait
Variability analysis of the phase portrait allows one to describe the inter-cycle fluctuation based on the changes in the centroid of each cycle. Centroid drift and centroid area were computed to quantify variability (Fig.2; (DiBerardino, 2010)). Centroid drift was defined as the total path traveled by the centroid over a desired analysis range. Centroid area was defined as the 95% confidence ellipse area that encompassed the centroids. Larger drift and area values indicate greater inter-cycle fluctuation.
Complexity of phase portrait
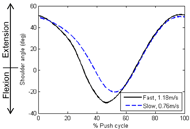 Figure 3: Average shoulder kinematics at different speed conditions. d
Complexity analysis quantifies the shape of the phase portrait and examines intra-cycle irregularity. The complexity of a shape outline can be quantified by determining the shape’s frequency content using Fourier- based methods (Kuhl & Giardina, 1982). Complexity of a phase portrait was defined as the minimum number of harmonics suitable for fitting the phase portrait shape over a desired analysis range (DiBerardino et al., 2010). A larger number of harmonics indicates that the shape of the phase portrait is more irregular.
Statistics
The variability and complexity parameters were compared using repeated measure ANOVA with fast and slow speed as the within-subject factor. (SPSS v20; Chicago, IL, USA).
RESULTS
The average pushing speed for the fast condition was 1.18±0.02 m/s, while the pushing speed for slow condition was 0.76±0.03 m/s. The propulsion speeds were significantly different between the two conditions (p < 0.05). It is clear in Figure 3 that the average motion of the shoulder in the sagittal plane is influenced with propulsion speed. The average RPE of the fast speed was 9.0±2.4, and that of the slow speed was 7.4±1.5.
| Measures [Units] | Average (SD) |
p |
F |
Partial η2 |
|
|---|---|---|---|---|---|
| Slow (0.76m/s) |
Fast (1.18m/s) |
||||
| Variability: | |||||
| Centroid Area [rad2/s] |
0.023 (0.01) | 0.035 (0.02) | 0.06 | 4.49 | 0.382 |
| Centroid Drift [Cartesian Dist.] |
1.15 (0.24) | 1.33 (0.44) | 0.20 | 2.02 | 0.202 |
| Complexity: | |||||
| No. of Harmonics | 171 (27) | 144 (28) | <0.05 | 10.3 | 0.559 |
Results of the variability and complexity analyses are reported in Table 1. There was a trend for the centroid area to increase with propulsion speed, but a traditional level of significance was not reached (p = 0.06). The centroid drift did not change with speed (p = 0.20) (Fig. 4). The complexity decreased as the speed increased (p < 0.05) (Fig. 2 and 5).
DISCUSSION
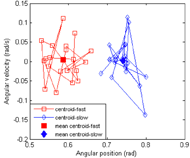 Figure 4: Centroids of a representative subject at fast and slow speeds. The centroid areas of fast and slow speeds are 0.041 and 0.037 (rad2/s) respectively while those of drift paths are 1.43 and 1.51 (Cartesian distance). d
The goal of this preliminary investigation was to examine a novel method of quantifying variability and complexity in wheelchair propulsion and its association with propulsion speed. The parameters at fast (1.18±0.02 m/s) and slow (0.76±0.30 m/s) speed conditions were analyzed and compared. It was found that phase portraits of shoulder flexion-extension were able to quantify changes in propulsion motion as speed increases.
Shoulder kinematics were also reported in traditional time-series kinematics for comparison to the literature (Fig.
Flexion Extension nn
3). The shoulder kinematics in our study are in agreement with previous reports in terms of both the range of motion and the behavior across push cycle (Collinger et al., 2008; Koontz et al., 2002).
The centroid area showed a trend of increasing with speed, but the association was not statistically significant (p = 0.06; Table 1). The increase in cycle to cycle fluctuations at the faster propulsion speed coincides with the notion that the amount of variability scales with the magnitude of the signal (Schmidt et al., 1979).
In contrast to the centroid area, the effect of speed was not significant on the centroid drift (p = 0.2, Table 1). According to DiBerardino et al. (2010), centroid area measures the actual bivariate variability around the mean centroid. While the total drift also measures the variability in terms of the path travelled by the centroids from cycle to cycle, it is not referenced to the average centroid. Therefore, depending on the centroid path, it is possible that drift paths were significantly different, while the areas were similar between different phase portraits (Fig. 4).
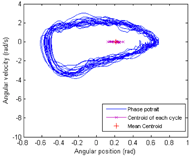 Figure 5: Phase portrait of a representative subject at slow speed. The shape of phase portrait is noticeably more irregular than that of fast speed illustrated in Figure 2. d
The complexity, which describes the intra-cycle fluctuation, was found to be significantly lower at fast speed (Table 1, Figure 2, and Figure 5). This lowered complexity is likely due to higher regularity required during propulsion in order to maintain a higher speed. To our knowledge this is the first investigation of complexity in wheelchair propulsion. There have been numerous investigations of complexity in gait. For instance, McGregor et al. (2009) found that complexity of lower limb movement as indexed by control entropy (CE), increased as the walking speed increases, peaked at the walking and running transition and decreased as running speed decreased. Our findings were consistent with the trend of McGregor’s study for running gait. However, direct comparisons should be interpreted with caution because running and propulsion require distinctly different movement strategies and our method of complexity analysis differed from the McGregor study.
The sample size in our study was too small to draw a definite conclusion in terms of the changes in variability and complexity at different speed conditions. Most of the participants were college students and were actively involved in wheelchair sports. Therefore, this study cannot reflect the variability and complexity of the diverse manual wheelchair population with different function levels.
The flexion-extension angle was analyzed as it represents the largest range of motion in the shoulder joint during wheelchair propulsion. Nevertheless, shoulder abduction-adduction and internal-external rotation contribute to the movement.
In conclusion, analysis of variability and complexity using the phase portrait technique allows us to provide additional insight of upper arm movement on top of basic kinematic metrics, such as joint angle, range of motion, and joint velocity. Specifically, this technique characterizes inter- and intra-cycle fluctuations (variability and complexity). Our future investigations will include a number of improvements from this preliminary work. We plan to recruit from a more diverse population, including greater age range, activity and functional level. Variability and complexity will be explored for all degrees of freedom at the shoulder joint.
REFERENCES
Borg, G. (1998). Borg's Perceived Exertion and Pain Scales. Champaign, IL: Human Kinetics.
Collinger, J. L., Boninger, M. L., Koontz, A. M., Price, R., Sisto, S. A., Tolerico, M. L., & Cooper, R. A. (2008). Shoulder biomechanics during the push phase of wheelchair propulsion: a multisite study of persons with paraplegia. Archives of Physical Medicine and Rehabilitation, 89(4), 667-676.
Cooper, R. A., Koontz, A. M., Ding, D., Kelleher, A., Rice, I., & Cooper, R. (2010). Manual wheeled mobility--current and future developments from the human engineering research laboratories. Disability and Rehabilitation, 32(26), 2210-2221.
Davids, K., Bennett, S., & Newell, K. (Eds.). (2005). Variabiltiy in Movement Systems: a Multi-Disciplinary Perspective. Champaign, IL: Human Kinetics.
DiBerardino, L. A., 3rd, Polk, J. D., Rosengren, K. S., Spencer-Smith, J. B., & Hsiao-Wecksler, E. T. (2010). Quantifying complexity and variability in phase portraits of gait. Clinical Biomechanics (Bristol, Avon), 25(6), 552-556.
Goldberger, A. L., Amaral, L. A. N., Hausdorff, J. M., Ivanov, P. C., Peng, C.-K., & Stanley, H. E. (2002). Fractal dynamics in physiology: alterations with disease and aging. Proceedings of the National Academy of Sciences of the United States of America, 99 Suppl 1, 2466-2472.
Hamill, J., van Emmerik, R. E., Heiderscheit, B. C., & Li, L. (1999). A dynamical systems approach to lower extremity running injuries. Clinical Biomechanics (Bristol, Avon), 14(5), 297-308.
Koontz, A. M., Cooper, R. A., Boninger, M. L., Souza, A. L., & Fay, B. T. (2002). Shoulder kinematics and kinetics during two speeds of wheelchair propulsion. Journal of Rehabilitation Research and Development, 39(6), 635-649.
Kuhl, F., & Giardina, C. (1982). Elliptic Fourier features of a closed contour. Computer Graphics and Image Processing, 18(3), 236-258.
McGregor, S. J., Busa, M. A., Skufca, J., Yaggie, J. A., & Bollt, E. M. (2009). Control entropy identifies differential changes in complexity of walking and running gait patterns with increasing speed in highly trained runners. Chaos (Woodbury, N.Y.), 19(2), 026109.
Newell KM, Vaillancourt DE, & Sosnoff JJ. (2006). Aging, complexity and motor performance: healthy and disease states. In J.E. Birren & K.W. Schaie (Eds.), Handbook of the psychology of aging (6th Ed.) (p 163-182). Amsterdam: Elsevier.
Schmidt, R. A., Zelaznik, H., Hawkins, B., Frank, J. S., & Quinn, J. T., Jr. (1979). Motor-output variability: a theory for the accuracy of rapid motor acts. Psychological Review, 47(5), 415-451.
Seay, J. F., Van Emmerik, R. E. A., & Hamill, J. (2011). Low back pain status affects pelvis-trunk coordination and variability during walking and running. Clinical Biomechanics (Bristol, Avon), 26(6), 572-578.
Stergiou, N. (2004). Innovative analyses of human movement. Champaign, IL: Human Kinetics.
Wu, G., Vanderhelm, F., Dirkjanveeger, H., Makhsous, M., Vanroy, P., Anglin, C., Nagels, J., et al. (2005). ISB recommendation on definitions of joint coordinate systems of various joints for the reporting of human joint motion. Part II: shoulder, elbow, wrist and hand. Journal of Biomechanics, 38(5), 981-992.
ACKNOWLEDGEMENTS
The study is supported by the National Institute of Health grant #1R21HD066129-01A1. The authors would also like to thank Michael Socie, AJ Hermann, Katie White and Yae-Jin Moon for their assistance in data collection.