Amanda Manko![]() 1
1![]() , Patricia Karg
, Patricia Karg![]() 1
1![]() , David Brienza
, David Brienza![]() 1
1![]() , Alexandra Delazio
, Alexandra Delazio![]() 1
1![]() , Jenna Freedman
, Jenna Freedman![]() 1
1![]() , Emily Williams
, Emily Williams![]() 2
2![]()
![]() 1
1 ![]() University of Pittsburgh, Department of Rehabilitation Science and Technology
University of Pittsburgh, Department of Rehabilitation Science and Technology
![]() 2
2![]() University of Pittsburgh at Johnstown, Department of Mechanical Engineering
University of Pittsburgh at Johnstown, Department of Mechanical Engineering
INTRODUCTION
Pressure injuries are a major, yet common, complication affecting wheelchair users' health and quality of life. [1] They are often due to experiencing pressure over long periods of time from sitting without performing pressure relief maneuvers. Because of the nature of wheelchair use, extended periods of pressure related to sitting is inevitable. Pressure injury treatment is lengthy, expensive, and severely limits functional capacity. Due to this, wheelchair cushions of varying design are used to maintain tissue integrity and proper posture. [2]
Over time, cushions may experience degradation of mechanical properties which inhibits their ability to properly support the buttocks. A previous study showed through loaded contour depth testing that a significant difference in immersion depth occurred post simulated aging. [3] These differences indicated that as some cushion wear, a bottoming out effect occurs, which reduces their pressure-distributing characteristics.
METHODS
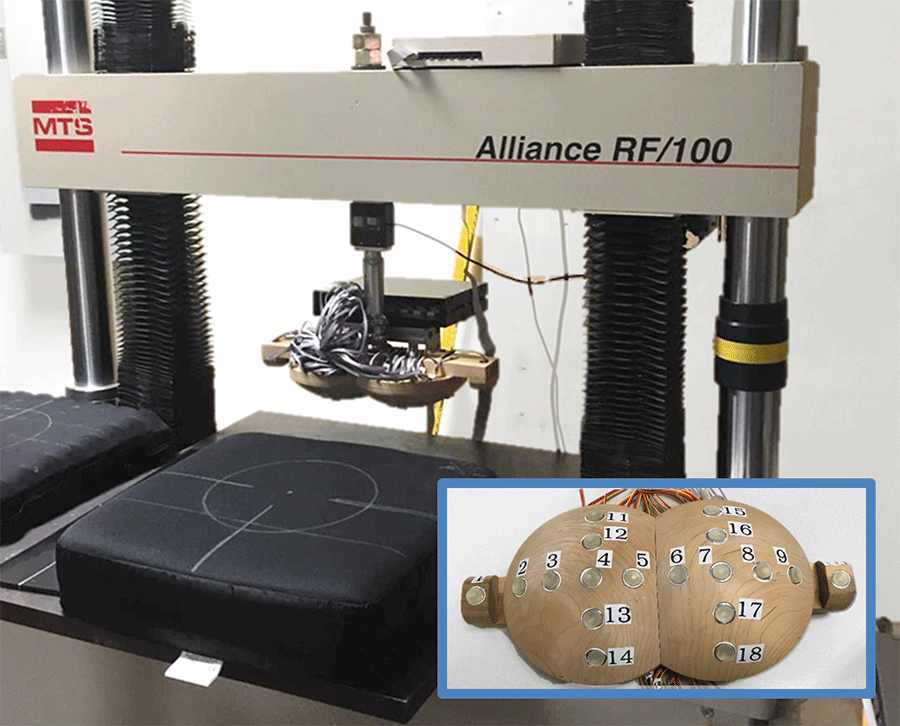
A cohort of 21 cushions of varying constructs were selected to represent general use, skin protection, and positioning cushions on the market at the time of selection. The RESNA WC-3 seating standards define performance tests used to characterize changes in cushion properties and the minimal methods for simulated aging. [4] We selected eight tests that measured loaded contour depth and overload deflection, impact damping, hysteresis, interface pressure, 10% force deflection, horizontal stiffness, sliding resistance, and envelopment. Loaded contour depth and overload deflection reflect the cushions ability to immerse the buttocks. Impact damping measures the cushions ability to reduce impact loading on soft tissue and maintain postural stability. Hysteresis measures the cushions ability to provide continual support during loading and unloading, indicating the tendency of the cushion to retain the contoured shape of the user after unloading, rather than bouncing back to the original shape. Interface pressure measurements assess the magnitude and distribution of pressure on a loaded cushion. The 10% force deflection test measures the elastic deformation of the cushion under a load, which is the earliest indicator of surface aging. Horizontal stiffness characterizes cushion response to shear forces. Sliding resistance provides an approximation on the slipperiness of the cushion, indicating how likely a user is to slide off the cushion into a compromised position. Envelopment testing is used to measure the cushions ability to immerse and envelop the buttocks, and thus distribute pressures evenly to maintain tissue integrity. This test is performed with two sizes of rigid indenters outfitted with four elevations of pressure sensors. Elevation 1 represents the ischial tuberosities and levels continue through Elevation 4 representing the trochanters.
Simulated aging methods were performed in the following order: disinfection, laundering, accelerated aging for half the indicated time period, cyclic loading at room temperature, accelerated aging for half the indicated time period, disinfection, and laundering. Laundering and disinfection were performed according to manufacturer instructions. Accelerated aging heated cushions for 33 days at 50°C for cushions containing materials that degrade at elevated temperatures or 11 days at 70°C otherwise. The cyclic loading procedure repeatedly applied a 500N force for 17500 cycles through a rigid indenter modeled after the buttocks and thighs. [4] The combined procedures are estimated to simulate 18-24 months of use. The cushion cohort was subjected to the eight performance tests pre and post simulated aging.
Each test metric was compared pre and post aging. For those in which normality existed, a paired t-test was used. For those in which normality was not found, a Wilcoxon signed-ranks test was performed. The comparative performance results were analyzed using IBM SPSS Statistics 26 software. All correlations were conducted with a 95% confidence interval. Magnitudes of small, medium, and large effect sizes were categorized as 0.0 to 0.3, 0.4 to 0.6, and 0.7 and above, respectively.
RESULTS
The mean and standard deviation, p-value, and effect size for each comparative metric of all eight performance tests are shown in Table 1. Loaded Contour Depth test metric for the second overload decreased post aging with a medium effect size. Impact Damping Impact 1 and Impact Ratio test metrics increased with large effect sizes. Hysteresis at 250N and 500N decreased with medium effect sizes. For Pressure Mapping, contact area, and Peak Pressure Index (PPI) in the Right Base Zone (RBZ) and Left Base Zone (LBZ) decreased with large effect sizes. For 10% deflection, the average force at 60 seconds increased with a medium effect size. Horizontal Stiffness peak and final horizontal forces decreased with large effect sizes. The average Sliding Resistance slip force decreased with a medium effect size. For Envelopment, the small indenter immersion under normal and overload slightly decreased with a medium effect but remained similar for the large indenter. The average pressures at the four elevations slightly decreased from pre to post-aging, with those at Elevation 1 and 3 for the small indenter having a medium effect size (all else were small effect sizes).
| Test Method | Variable | Pre-Aging Mean (SD) | Post-Aging Mean (SD) | p-value | Z (where applicable) | Effect Size |
|---|---|---|---|---|---|---|
| Loaded Contour Depth and Overload Deflection | L135 Loaded Contour Depth (mm) | 46.3 (15.2) | 48.0 (14.7) | .159 | -1.309 | 0.3 Small |
| L180 Overload (mm) | 4.2 (1.8) | 4.0 (1.4) | .463 | - | -0.2 Small | |
| L225 Overload (mm) | 8.4 (2.9) | 7.7 (2.1) | .078 | - | -0.4 Medium | |
| Impact Damping | Impact 1 (m/s2) | 27.65 (4.74) | 33.71 (4.10) | .000 | - | 1.9 Large |
| Impact Ratio (%) | 39.79 (10.16) | 56.66 (6.63) | .000 | - | 2.3 Large | |
| Hysteresis | Hysteresis @ 250N (%) | 15.20 (8.94) | 14.03 (8.02) | .012 | -2.520 | -0.5 Medium |
| Hysteresis @ 500 N (%) | 11.10 (5.77) | 9.80 (4.76) | .019 | -2.346 | -0.5 Medium | |
| Interface Pressure Measurement | Dispersion Index (%) | 47.14 (10.54) | 46.05 (9.84) | .340 | - | -0.2 Small |
| Contact Area (mm2) | 83519 (19945) | 77895 (18485) | .001 | - | -0.9 Large | |
| PPI LBZ (mm Hg) | 122 (36) | 92 (28) | .000 | - | -1.2 Large | |
| PPI RBZ (mm Hg) | 128 (34) | 92 (29) | .000 | - | -1.2 Large | |
| 10% Force Deflection | Average Force at 60s (N) | 85.34 (100.98) | 91.07 (100.56) | .106 | -1.616 | 0.4 Medium |
| Horizontal Stiffness* | Peak Horizontal Force (N) | 157.42 (56.65) | 134.12 (47.75) | .000 | - | -1.1 Large |
| Final Horizontal Force (N) | 119.66 (47.24) | 103.35 (38.00) | .001 | -3.250 | -0.7 Large | |
| Sliding Resistance | Average Slip Force (N) | 93.84 (60.05) | 61.49 (18.31) | .024 | -2.259 | -0.5 Medium |
| Envelopment Small Indenter | Immersion Normal Load (mm) | 65.29 (16.32) | 64.18 (15.56) | .064 | -1.851 | -0.4 Medium |
| Elevation 1 Normal Load (mmHg) | 244.12 (88.44) | 232.76 (102.50) | .385 | - | -0.2 Small | |
| Elevation 2 Normal Load (mmHg) | 180.71 (65.96) | 176.59 (67.26) | .349 | - | -0.2 Small | |
| Elevation 3 Normal Load (mmHg) | 131.76 (40.51) | 126.41 (37.33) | .215 | - | -0.3 Small | |
| Elevation 4 Normal Load (mmHg) | 115.12 (73.28) | 118.35 (63.72) | .618 | - | 0.1 Small | |
| Immersion Overload (mm) | 68.82 (16.36) | 67.88 (16.11) | .082 | -1.740 | -0.4 Medium | |
| Elevation 1 Overload (mmHg) | 296.29 (100.58) | 285.06 (111.22) | .124 | -1.538 | -0.4 Medium | |
| Elevation 2 Overload (mmHg) | 211.53 (70.38) | 206.94 (72.64) | .351 | - | -0.2 Small | |
| Elevation 3 Overload (mmHg) | 152.59 (46.68) | 145.65 (42.77) | .165 | - | -0.4 Medium | |
| Elevation 4 Overload (mmHg) | 137.94 (79.57) | 141.76 (70.42) | .566 | - | 0.1 Small | |
| Envelopment Large Indenter | Immersion Normal Load (mm) | 61.41 (16.10) | 61.35 (13.74) | .963 | - | -0.01 Small |
| Elevation 1 Normal Load (mmHg) | 184.53 (77.39) | 183.59 (82.26) | .925 | - | -0.02 Small | |
| Elevation 2 Normal Load (mmHg) | 159.71 (58.85) | 151.59 (50.54) | .268 | - | -0.3 Small | |
| Elevation 3 Normal Load (mmHg) | 117.59 (30.61) | 116.47 (26.65) | .756 | -0.310 | -0.1 Small | |
| Elevation 4 Normal Load (mmHg) | 89.59 (59.40) | 81.88 (42.53) | .572 | -0.565 | -0.1 Small | |
| Immersion Overload (mm) | 65.12 (16.37) | 65.29 (14.25) | .890 | - | 0.03 Small | |
| Elevation 1 Overload (mmHg) | 224.76 (83.85) | 216.24 (95.45) | .568 | - | -0.1 Small | |
| Elevation 2 Overload (mmHg) | 185.47 (64.49) | 175.76 (57.63) | .207 | - | -0.3 Small | |
| Elevation 3 Overload (mmHg) | 136.00 (35.65) | 136.24 (31.24) | .981 | -0.024 | 0.01 Small | |
| Elevation 4 Overload (mmHg) | 108.29 (62.43) | 104.76 (50.84) | .761 | - | -0.1 Small | |
| *One cushion was not tested due to equipment failure; ** Four cushions could not be tested due to pressure sensor saturation. | ||||||
DISCUSSION
Degradation of cushions' performance can be measured by their ability to distribute weight over a large surface area without concentrations of load. Decreased performance is an indication of reduced ability to maintain tissue integrity. This study aimed to evaluate performance degradation following a simulated aging method. The performance tests for loaded contour depth, impact damping, 10% force deflection, sliding resistance, hysteresis, and horizontal stiffness all indicated a decrease in cushion performance post aging. Envelopment and pressure mapping indicated an increase in performance post aging.
Loaded contour depth (LCD) measures immersion using an indenter representing a partial pelvis (representing the ischial tuberosities and trochanters). A higher LCD immersion indicates increased capability for pressure distribution. The study showed a very small increase in LCD with a related decrease in overload deflection indicating a stiffening of the cushion and diminished ability to redistribute pressure after aging, resulting in a greater risk of pressure injury.
Within impact damping, increased comfort and stability are achieved through a lower Impact 1 value. Increased energy absorption through reduced bouncing is achieved with a lower Impact Ratio. Since both metrics increased post aging and show a large effect, it can be concluded that changes in cushion properties resulted in decreased energy absorption and stability. A low slip force value in sliding resistance testing means the cushion is more slippery and the user will experience an increased tendency to slide out of position. Average slip force decreased significantly post aging which can greatly affect sitting position and proper pressure distribution on the buttocks leading to risk of pressure injury. A low hysteresis value indicates greater ability to maintain support after a loading cycle, and decreased tendency to remain conformed to the user's shape. The lower hysteresis percentage post aging may be attributed to stiffening of the cushions materials which may present as greater support but could increase risk of pressure injury. High horizontal stiffness may offer greater postural stability, but the chance of tissue deformation increases due to the shear forces present. The decrease in peak and final forces post aging indicate decreased stability but may help to accommodate in-seat movement and transfers through lower shear forces.
During pressure mapping, it is understandable to see dispersion index (percent of load in ischial-sacral area) decrease and contact area increase as the cushion is worn in. When degradation occurs, the cushion no longer disperses pressure as effectively. The dispersion index decreased, but unexpectedly, contact area also decreased. It is expected that contact area would increase with greater immersion. The decreasing contact area could be due to cushion stiffening or bottoming out, as shown by the changes in the overload deflection, hysteresis and 10% force deflection metrics.
For the envelopment test with the instrumented indenter, when the pressure readings from each elevation are similar in magnitude, the cushion is redistributing pressures equally across the buttocks. For the small indenter, in both normal load and overload, pressures at elevations 1 to 3 decreased post aging and appear to have shifted to elevation 4 (trochanters), indicating better envelopment by the cushion. The envelopment test indicated the simulated aging procedure improved pressure distribution with a slight decrease (small indenter) or no change (large indenter) in immersion. Better pressure distribution is not inconsistent with less immersion if the reason for the improved distribution of load is either increased contact area or better fit between the load and the support. In this study, the contact area decreased, suggesting that the improvement in load distribution resulted from a better fit between the load and the supporting cushions. Reasons for an improvement to fit might include a change in stiffness distribution across the surface of the cushion where the areas of the cushion contacting the prominent portions of the indenter (regions simulating the ITs) become less stiff, and a pre-contouring (change in shape of the unloaded cushion) to match the shape of the indenter more closely. A more evenly distributed pressure distribution suggests lower risk of pressure injury.
CONCLUSION
The minimum simulated aging method in the RESNA standard had a clear effect on cushion performance characteristics. Some tests showed cushion stiffening, decreased immersion and decreased stability. While those that measured pressure distribution directly showed an improvement in performance after aging. These changes can greatly impact a user's risk of pressure injuries. Continued testing after additional aging cycles is underway to assess the lifespan of a cushion and what changes are to be expected with extended use.
REFERENCES
- Sonenblum, S. E., Vonk, T. E., Janssen, T. W., & Sprigle, S. H. (2014). Effects of Wheelchair Cushions and Pressure Relief Maneuvers on Ischial Interface Pressure and Blood Flow in People with Spinal Cord Injury. Archives of Physical Medicine and Rehabilitation, 95(7), 1350-1357.
- Mendes, P. V. B., Gradim, L. C. C., Silva, N. S., Allegretti, A. L. C., Carrijo, D. C. D. M., & Cruz, D. M. C. D. (2018). Pressure distribution analysis in three wheelchairs cushions of subjects with spinal cord injury. Disability and Rehabilitation: Assistive Technology, 14(6), 555-560.
- Linden, M. & Sprigle, S. (2006) Changes in Wheelchair Cushions as a Result of Simulated Use Protocols. Presented at 29th Annual RESNA Conference, Atlanta, GA.
- RESNA (2018). RESNA American National Standard for Wheelchairs - Volume 3: Wheelchair Seating. Rehabilitation Engineering and Assistive Technology Society of North America. Arlington, VA.
ACKNOWLEDGEMENT
The contents of this abstract were developed under a grant from the NIDILRR (grant number 90REGE0001-01-00), within the Administration for Community Living, Department of Health and Human Services. The contents of this abstract do not necessarily represent the policy of NIDILRR, ACL, or HHS, and you should not assume endorsement by the Federal Government.