B. Quiala Llera1, R. Chandrashekhar2, H. Wang2
1University of Florida College of Engineering, 2University of Florida College of Public Health and Health Professions
INTRODUCTION
Wearable devices such as fitness trackers, smartwatches, and motion sensors can measure various parameters related to functional mobility, such as gait speed, step count, and distance walked.[1] These devices can also monitor other factors like heart rate, blood pressure, and oxygen saturation, providing additional insights into a person's functional mobility.[2,3] However, it's important to note that the accuracy and reliability of wearable devices can vary depending on the specific device and the individual being assessed.[4] As with any assessment tool, wearable devices for measuring the functional test should be combined with other assessments to obtain a comprehensive understanding of an individual's mobility and balance.[5–7] As the wearable technology evolves and different devices have been used for different studies, researchers and clinicians must stay updated with the latest wearable devices and their performance, especially when used during functional tasks.
This study compared performance using the output parameters (i.e., steps, distance, heart rates) of three latest wearable activity trackers (Fitbit Charge 5, Garmin Vivosmart 4, and the Xiaomi Band 7) during performing of six functional tasks.
METHODS
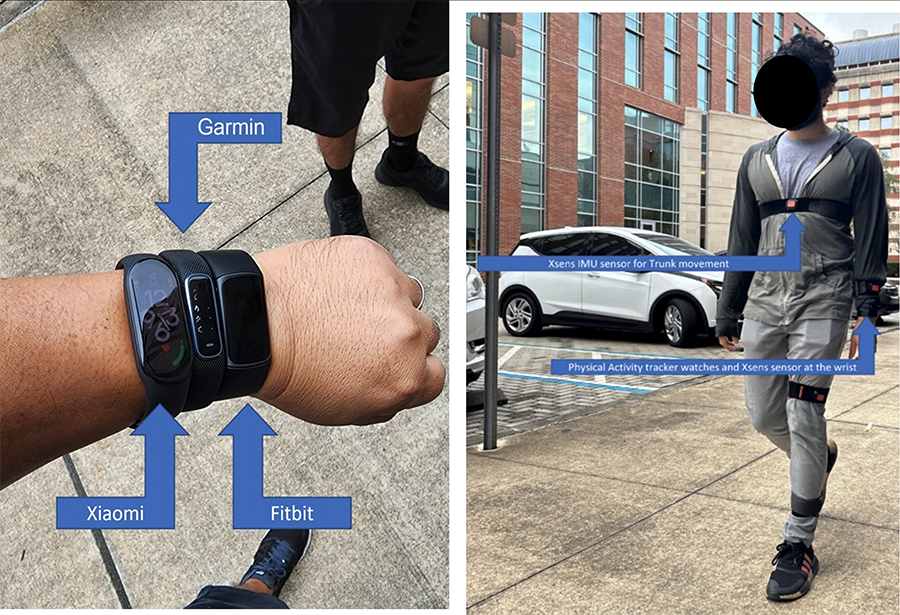
We conducted an exploratory pilot feasibility study with a convenience sample of four adults over 18 years of age working in our lab, at the University of Florida. Participants wore the Xsens DOT, Fitbit Charge 5, Garmin Vivosmart 4, and Xiaomi Band 7 simultaneously during the trials as shown in Figure 1. All participants completed three trials of each of the six functional and clinical outcome measures in the same order: (a) 30-second chair stand test, (b) six-minute walk test (6MWT), (c) timed up and go (TUG), (d) fast-paced walk test, (e) 10-meter sprint test, and (f) stair climb test. A one-minute post-trial rest period was provided after all outcomes except for the fast-paced walk test and the 10-meter sprint test, where a two-minute and three-minute rest periods were provided respectively to ensure that the heart rate was not very high at the beginning of each subsequent trial. The data from each tracker/device was extracted using the manufacturer-provided Application Programming Interfaces (APIs) and Software Development Kits (SDKs) and downloaded from the online web portal. The output parameters from each physical activity tracker were analyzed separately for each task. Descriptive statistics were used for the data analysis.
RESULTS
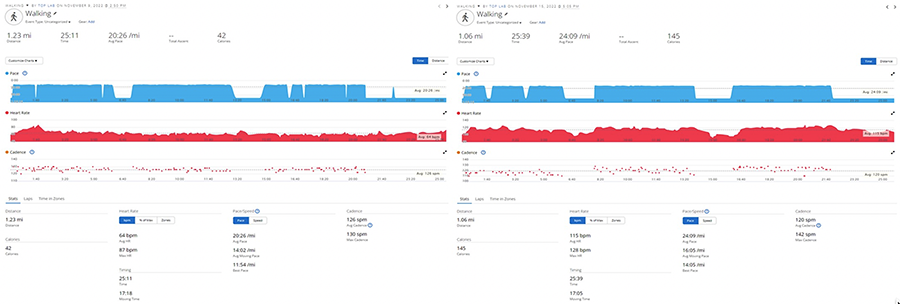
Data from the three physical activity trackers were extracted using the respective APIs and SDKs. The mean and standard deviations for the parameters are presented in Table 1. Heart rate, steps, distance and calories were tracked for all tasks by Fitbit Charge 5, heart rate and steps were tracked for all task by Xiaomi Band 7, while the Vivosmart 4 only tracked heart rate and speed for the 6-minute walk test. Figure 2 shows the visualized data obtained from Garmin Vivosmart 4. This data was presented separately as the data was sparse and not comparable to the data obtained from the Fitbit and Xiaomi devices.
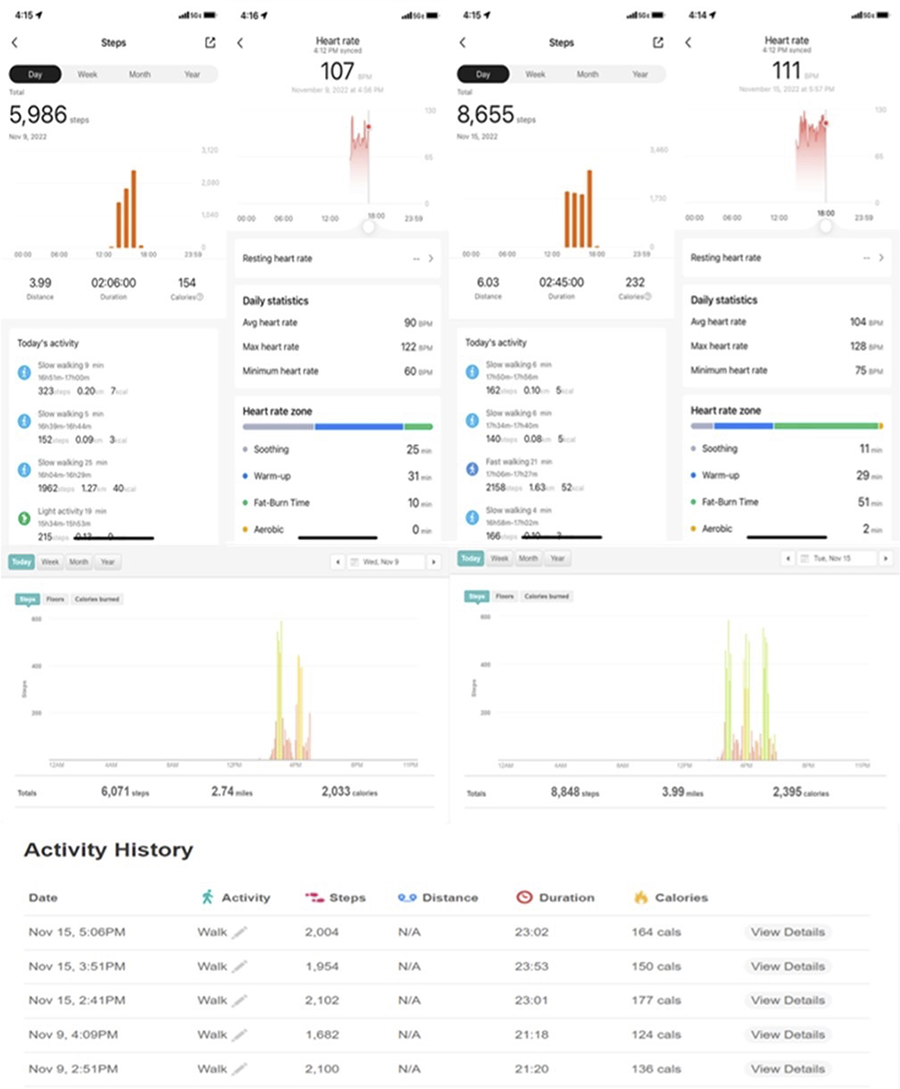
Figure 3 shows the visualized data from the Xiaomi and Fitbit. There was a small difference of 80~200 steps in the total step count, with the Xiaomi estimating a higher number of steps in five out of six tasks in Table 1. Additionally, the user portals did not provide all the information in Table 1, which included the raw data obtained from each device's API and SDK.
| 30-Second Chair Stand Test | |||||
| Device/Outcome | Heart Rate | Steps | Distance | Calories | Speed |
| Fitbit Charge 5 | 90.26 (14.01) | 32.23 (3.61) | 0.01 (0.002) | 4.41 (0.62) | NR |
| Xiaomi Band 7 | 95.71 (11.74) | 28.36 (14.47) | NR | NR | NR |
| Garmin Vivosmart 4 | NR | NR | NR | NR | NR |
| 6-Minute Walk Test | |||||
| Device/Outcome | Heart Rate | Steps | Distance | Calories | Speed |
| Fitbit Charge 5 | 103.96 (14.44) | 90.09 (9.25) | 0.04 (0.004) | 6.85 (0.57) | NR |
| Xiaomi Band 7 | 104.37 (9.77) | 96.50 (5.01) | NR | NR | NR |
| Garmin Vivosmart 4 | 90.16 (34.28) | NR | NR | NR | 1.51 (0.17) |
| Timed Up and Go Test | |||||
| Device/Outcome | Heart Rate | Steps | Distance | Calories | Speed |
| Fitbit Charge 5 | 87.67 (12.23) | 9.88 (1.65) | 0.004 (0.001) | 3.20 (0.356) | NR |
| Xiaomi Band 7 | 112 (2.83) | 30.38 (42.01) | NR | NR | NR |
| Garmin Vivosmart 4 | 89.70 (28.71) | NR | NR | NR | NR |
| Fast Paced Walk Test | |||||
| Device/Outcome | Heart Rate | Steps | Distance | Calories | Speed |
| Fitbit | 89.33 (13.68) | 22.92 (3.38) | 0.01 (0.002) | 3.79 (0.92) | NR |
| Xiaomi Band 7 | 109.25 (20.12) | 33.98 (8.47) | NR | NR | NR |
| Garmin Vivosmart 4 | NR | NR | NR | NR | NR |
| 10-meter Sprint Test | |||||
| Device/Outcome | Heart Rate | Steps | Distance | Calories | Speed |
| Fitbit | 89.38 (11.26) | 13.25 (2.42) | 0.006 (0.001) | 3.42 (1.05) | NR |
| Xiaomi | 100.39 (13.61) | 36.14 (9.87) | NR | NR | NR |
| Garmin Vivosmart 4 | NR | NR | NR | NR | NR |
| Stair Climb Test | |||||
| Device/Outcome | Heart Rate | Steps | Distance | Calories | Speed |
| Fitbit Charge 5 | 96.99 (17.47) | 23.35 (10.94) | 0.011 (0.005) | 4.50 (1.50) | NR |
| Xiaomi Band 7 | 89 (5.37) | 23.54 (7.10) | NR | NR | NR |
| Garmin Vivosmart 4 | NR | NR | NR | NR | NR |
DISCUSSION
The Fitbit Charge 5 and Xiaomi Band 7 were able to track heart rate and steps for all different functional tasks performed during the test session and the Garmin Vivosmart 4 tracker was inconsistently across the tasks. This finding showing the underestimation of activity by Garmin Vivosmart 4 is corroborated by existing literature.[8] Fitbit Charge 5 and Xiaomi Band 7 showed some agreements in 30-second Chair Stand Test, 6-minutes walking, and stair climb test, but larger discrepancies in the Timed-up and Go, fast-pace walk, and 10-meter spring test. These findings agreed with the literature that performance of the wearables could be task specific. We noticed that the heart rate was the only common variable that was most consistently recorded across all three devices. While the heart rate and steps data were estimated by the Fitbit as well as the Xiaomi devices, they are not always in complete agreement;[9] There are instances where one or both these trackers over- or underestimate the physical activity data based on the functional task. For instance, during the 30-second chair stand test, the Xiaomi tracker initially overestimated the steps when compared to the Fitbit in some trials while the vice versa was true for the other trials. It is also important here to note that in the Xiaomi band, the steps were never zero, even during periods of rest, indicating a potential inaccuracy due to overestimation. This finding is supported by certain reports highlighting the poor reliability and/or validity of some of these trackers.[10] These results are intriguing and the next steps involve comparing some of the performance measures like distance, cadence, steps, etc., obtained from these physical activity trackers with the data obtained from the XSens DOT, which is known for more accurate human motion tracking.
REFERENCES
[1] Peters DM, O'Brien ES, Kamrud KE, Roberts SM, Rooney TA, Thibodeau KP, et al. Utilization of wearable technology to assess gait and mobility post-stroke: a systematic review. J Neuroeng Rehabil 2021;18:67. https://doi.org/10.1186/s12984-021-00863-x.
[2] Jo A, Coronel BD, Coakes CE, Mainous AG. Is There a Benefit to Patients Using Wearable Devices Such as Fitbit or Health Apps on Mobiles? A Systematic Review. Am J Med 2019;132:1394-1400.e1. https://doi.org/10.1016/j.amjmed.2019.06.018.
[3] Georgiou K, Larentzakis AV, Khamis NN, Alsuhaibani GI, Alaska YA, Giallafos EJ. Can Wearable Devices Accurately Measure Heart Rate Variability? A Systematic Review. Folia Med (Plovdiv) 2018;60:7–20. https://doi.org/10.2478/folmed-2018-0012.
[4] Vijayan V, Connolly JP, Condell J, McKelvey N, Gardiner P. Review of Wearable Devices and Data Collection Considerations for Connected Health. Sensors 2021;21:5589. https://doi.org/10.3390/s21165589.
[5] Wearable technologies to measure clinical outcomes in multiple sclerosis: A scoping review - Sarah Alexander, Guy Peryer, Emma Gray, Frederik Barkhof, Jeremy Chataway, 2021 n.d. https://journals.sagepub.com/doi/10.1177/1352458520946005 (accessed February 24, 2023).
[6] Babaei N, Hannani N, Dabanloo NJ, Bahadori S. A Systematic Review of the Use of Commercial Wearable Activity Trackers for Monitoring Recovery in Individuals Undergoing Total Hip Replacement Surgery. Cyborg Bionic Syst 2022;2022:9794641. https://doi.org/10.34133/2022/9794641.
[7] Balbim GM, Marques IG, Marquez DX, Patel D, Sharp LK, Kitsiou S, et al. Using Fitbit as an mHealth Intervention Tool to Promote Physical Activity: Potential Challenges and Solutions. JMIR Mhealth Uhealth 2021;9:e25289. https://doi.org/10.2196/25289.
[8] Schaffer SD, Holzapfel SD, Fulk G, Bosch PR. Step count accuracy and reliability of two activity tracking devices in people after stroke. Physiotherapy Theory and Practice 2017;33:788–96. https://doi.org/10.1080/09593985.2017.1354412.
[9] Jachymek M, Jachymek MT, Kiedrowicz RM, Kaźmierczak J, Płońska-Gościniak E, Peregud-Pogorzelska M. Wristbands in Home-Based Rehabilitation—Validation of Heart Rate Measurement. Sensors 2022;22:60. https://doi.org/10.3390/s22010060.
[10] Domingos C, Correia Santos N, Pêgo JM. Association between Self-Reported and Accelerometer-Based Estimates of Physical Activity in Portuguese Older Adults. Sensors 2021;21:2258. https://doi.org/10.3390/s21072258.