R. Chandrashekhar>1, J. Zhang>2, H. Wang>1
>1University of Florida Department Occupational Therapy, >2University of Florida Department of Biology
INTRODUCTION
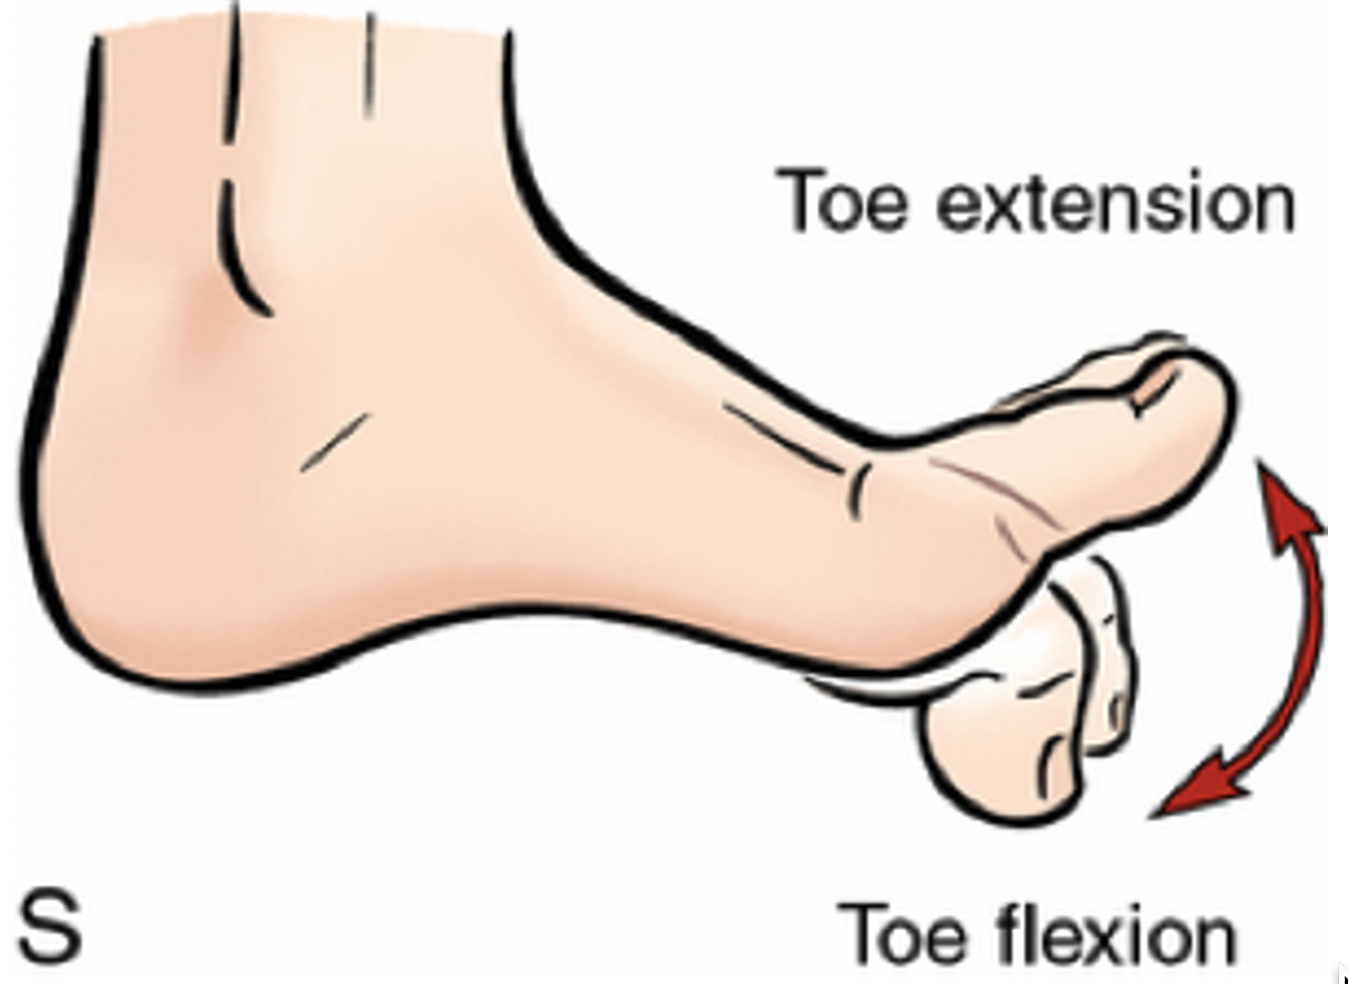
One of the most crucial components of normal walking and balance under-researched is the strength and range of motion of the metatarsophalangeal joint (MTJ) or the great toe. [1–3] Great toe flexion and extension depicted in Fig. 1 represent the two movements involved in generating propulsion forces during walking and maintaining balance/stability of the foot during different phases of gait. [4–6] The great toe is also part of the first ray of the foot (a single functional unit of the foot consisting of the MTJ and cuneiform bones)[7], which is reported to bear 40-60% of an individual's body weight during the mid- and terminal stance phases of gait.[4,8,9] Researchers have reported a large degree of coactivation in the tibialis anterior (TA) with the flexor hallucis longus and brevis muscles, particularly during certain functional tasks related to balance, with.[10] These findings further corroborate studies reporting an association between great toe strength (GTS) and outcomes of functional mobility, balance, and gait. [11–14] Additionally, GTS is a potential clinical biomarker which could be used to evaluate the onset or progression of health conditions such as peripheral neuropathy or radiculopathy. [3,12,14,15] Despite this, GTS, particularly great toe extension strength (GTES), is often overlooked during routine physical checkups or clinical practice.[15]
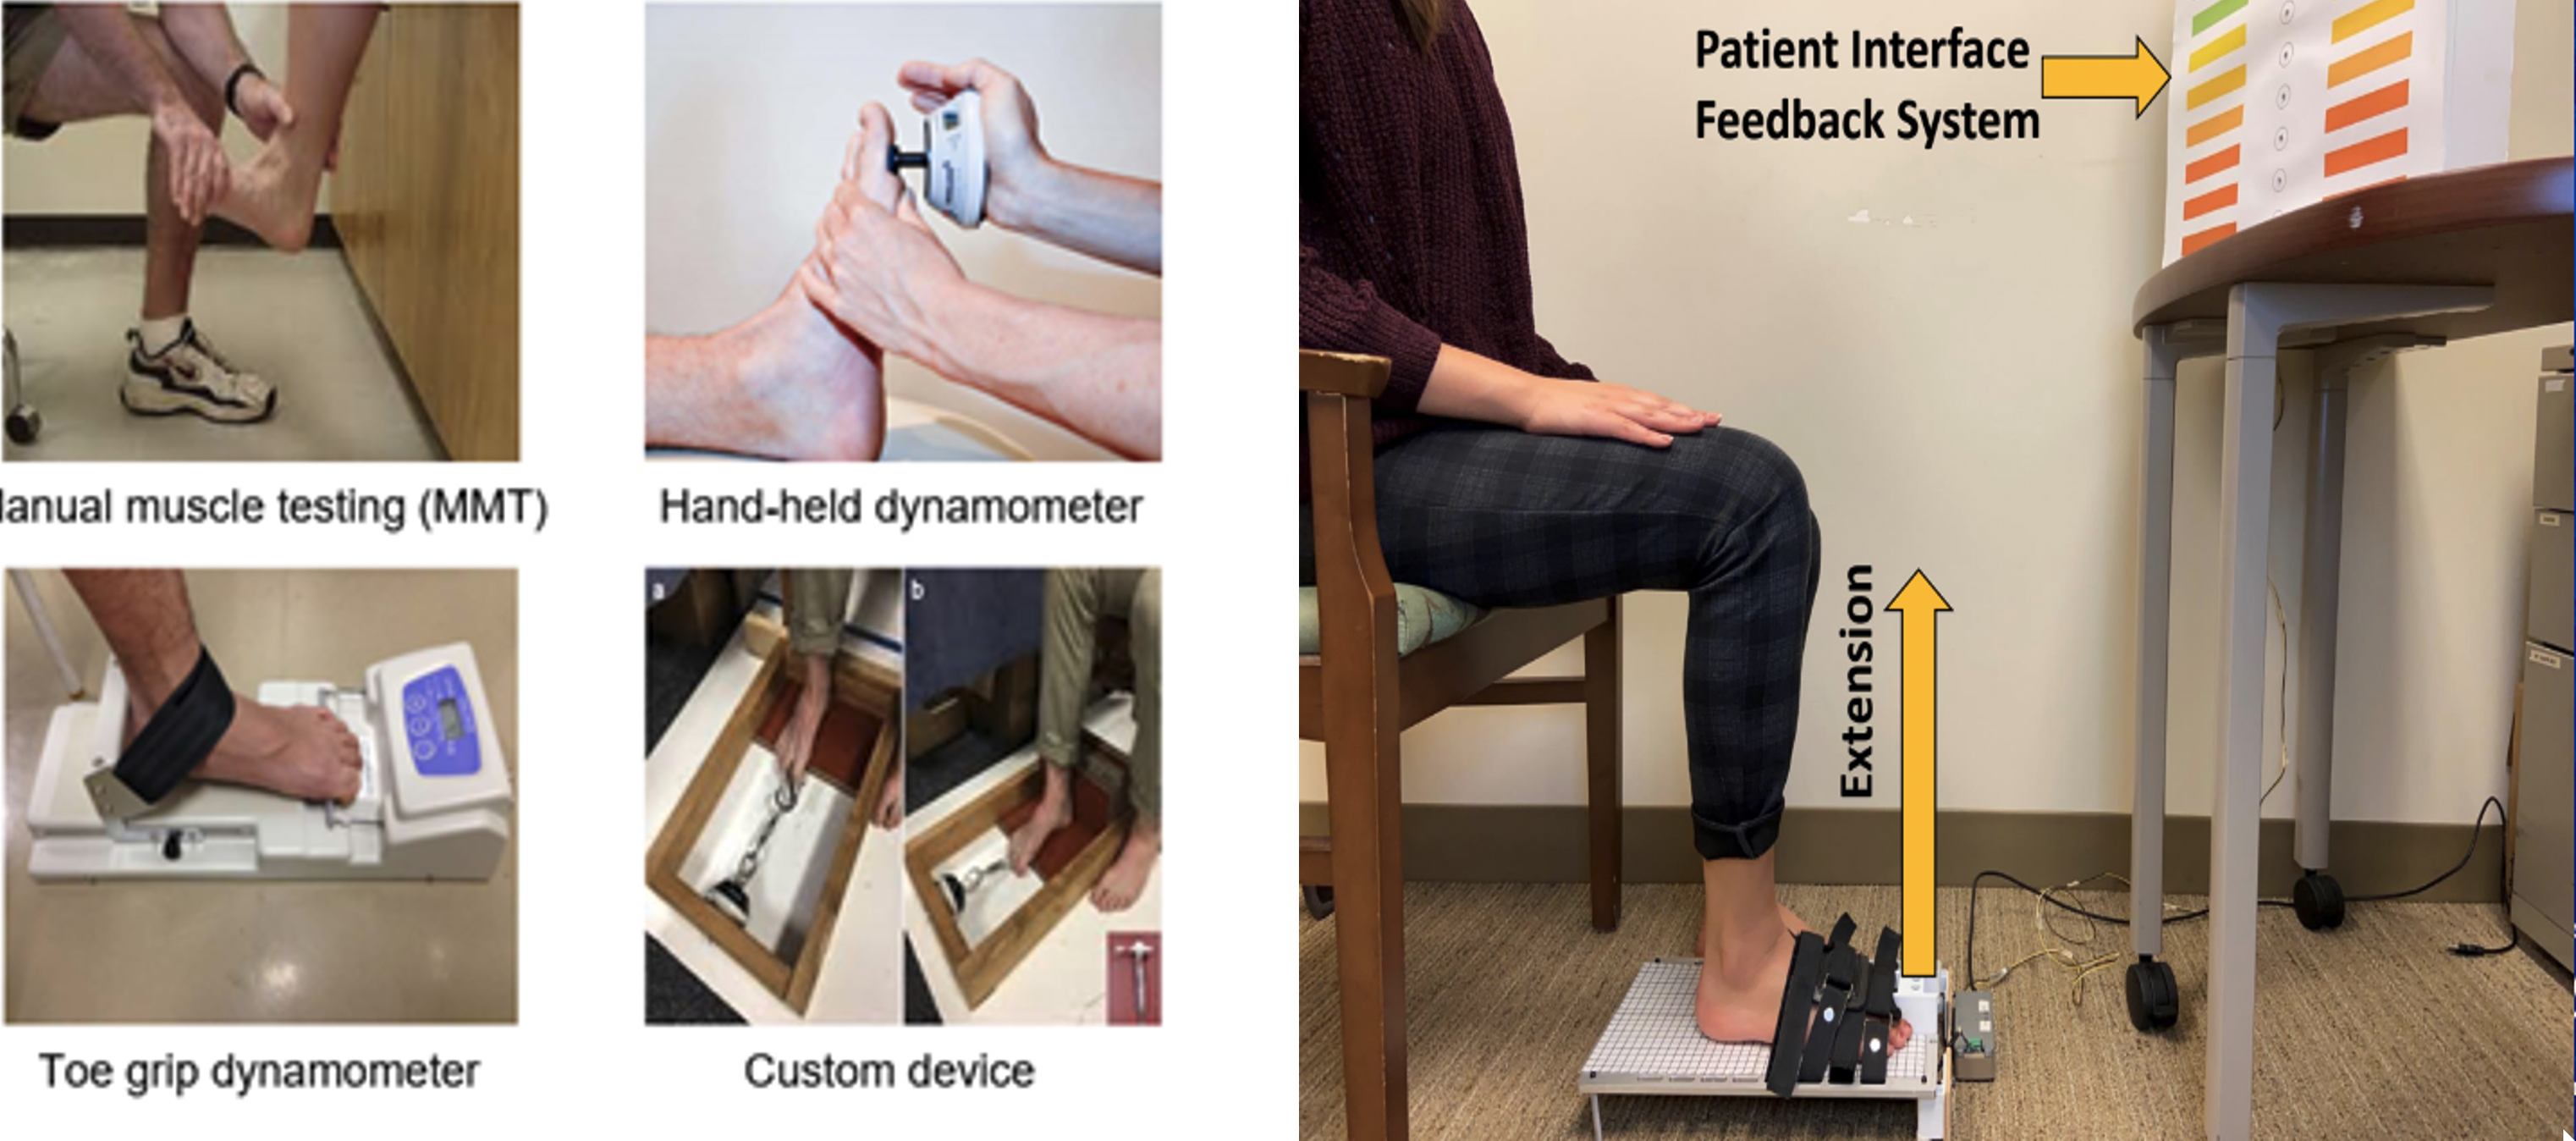
While different methods and technologies have been used to measure GTES (Figure 2(a)), such as manual muscle testing (MMT),[16,17] hand-held dynamometry,[18,19] custom devices developed in research labs,[20] and toe grip dynamometry,[13] the most commonly used clinical standard for muscle strength measurement is MMT. MMT involves the evaluator using their own internal "gauge" to monitor and evaluate the forces exerted by the participant/patient. Similarly, hand-held dynamometry is also affected by force exerted by the evaluator. Some studies have also raised concerns regarding the discriminant validity of MMT, particularly in the higher grades (Grades 3 to 5), where the sensitivity of MMT is inadequate to detect smaller changes in muscle strength. A pseudo ceiling effect could potentially limit the detection of smaller changes with clinical or research significance [21]. Although the existing methods have reasonable psychometric properties, multiple research groups have reported potential inaccuracies and errors due to the subjective nature of these methods.[13,18,19,22] To address the limitations of the existing technologies and methodologies, we developed a novel, portable device, ToeScale, to measure GTES and this device is shown in Figure 2(b).[23] The purpose of this study is to establish early validation of the GTES measure by determining the relationship between GTES measured via the ToeScale with grip strength (GS) and their variation with demographic variables such as age, sex, and body mass index (BMI).
METHODS
We conducted a pilot cross-sectional feasibility study with a convenience sample of young and older adults. This study was part of a course project, where no identifiable information was collected as per the University of Florida IRB waiver guidelines. The primary outcome measures evaluated in this study were peak GTES and GS. Peak GTES was measured using the ToeScale with the participant seated in a chair with their knee and ankle maintained at right angles as shown in Figure 2(b). GS was measured using the Jamar handgrip dynamometer following clinical standard procedure. The participants were first asked to provide demographic information and the international physical activity questionnaire – short form (IPAQ-SF), then given the handgrip dynamometer for GS, which was followed by the peak GTES measurement. Descriptive statistics, correlation analyses, and independent sample t-tests were applied for data analysis.
RESULTS
|
Thirty-one participants volunteered for this study and the demographics are summarized in Table 1 along with the average duration (in minutes) of different types of physical activity in a day during the week prior to the assessment. Large within-group variances were observed in the IPAQ-SF items for different physical activities and only significant difference was in the duration of vigorous physical activity item between the two age groups. The differences in peak GTES and GS by age and sex (Table 2) indicate that males had a statistically significantly higher peak GTES than females among the young (p =0.013) and older (p =0.038) adults. Younger adults had higher mean peak GTES (~5.88N) as well as higher GS (~42.39N) than older adults, neither was statistically significant.
Outcome Measure/Group |
Younger Adults |
Older Adults |
Peak Great Toe Extension Strength (peak GTES) |
||
Peak GTES (Total Sample) |
47.27 (12.24) |
41.38 (18.82) |
Peak GTES (Males only) |
57.47 (11.81) |
58.08 (18.10) |
Peak GTES (Females only) |
41.60 (8.51) |
36.25 (16.39) |
Peak Grip Strength (peak GS) |
||
Peak GS (Total Sample) |
282.39 (103.26) |
239.99 (96.43) |
Peak GS (Males only) |
390.44 (45.17) |
355.37 (89.58) |
Peak GS (Females only) |
222.36 (70.40) |
204.50 (67.76) |
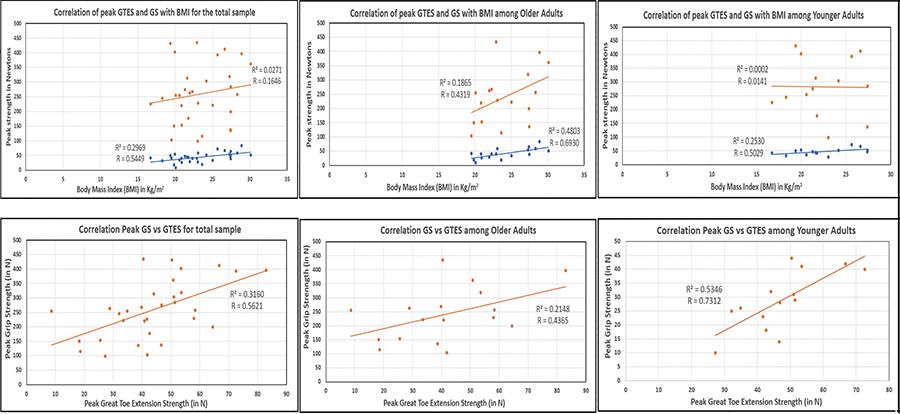
The correlation analyses revealed that peak GTES had significant (p<0.001) moderate positive (r =0.562) correlation with the GS for the total sample and significant (p=0.003) strong positive correlation (r =0.731) with GS among the younger adults; The comparison between the correlation of GS and peak GTES with BMI showed little to no correlation between GS and BMI, whereas, peak GTES had significant (p=0.004) moderate positive correlation (r =0.506) with BMI for the total sample as well as among older adults (r =0.598, p =0.011). The correlation plots are shown below in Figure 3.
DISCUSSION
The findings of this study indicate that peak GTES might vary based on gender and age and correlate with BMI more strongly than grip strength. Additionally, the correlation analyses of both primary outcomes with BMI revealed a stronger correlation of peak GTES with BMI than GS indicates that GTES could be a better predictor for functional mobility. The larger GTES variations among older adults were due to the different health conditions among the older adults. However, the ToeScale demonstrated good specificity to capture those differences. These findings are intriguing because, to the best of our knowledge, there are no known studies that have previously focused strictly on the relationship between GTES with BMI or GS. Muscle strength is a strong predictor of mobility limitation and GS is a well-established measure of overall muscle strength status that is widely used in clinical practice and it has also been used as an indicator of mobility limitation. [24,25] BMI and GS have both been associated with functional mobility, balance, and gait outcomes, where they have been used individually or in combination (using BMI to identify cut-off values/scores for GS), to determine mobility limitations, particularly among older adults. [26–28]
Although lower extremity muscle strength (LEMS) would potentially be more useful in predicting or identifying mobility limitations, GS is used because of its ease of use as existing methods for LEMS assessments are either time consuming, cumbersome, or require user effort. [29] The protocol presented in our study demonstrates the potential feasibility of LEMS assessment, particularly, the toe strength (flexion and extension). While GS is being used along with BMI as indicators of mobility limitations, there is ample evidence supporting the use of only BMI as a predictor of mobility limitation and other health conditions [30]; However, the findings from this study indicating a stronger correlation of BMI with GTES over GS indicates that GTES could potentially be a better indicator/predictor of mobility limitations and overall health, which can help in disease prevention.[6,9] While the results presented in this paper seem promising, future studies with larger samples and more methodological rigor are warranted. Furthermore, like BMI and GS, toe strength seems to decline with age and future research examining the relationship between toe strength and fall risks may contribute to new fall predictors. As the device is portable and convenient, it could be used for toe strength routine examination, which may help with early detection of aging-associated health conditions such as peripheral neuropathy. Additionally, identifying cut-off scores or normative values for GTES can be used to disease prevention.
REFERENCES
[1] Fujita M. Role of the metatarsophalangeal (MTP) joints of the foot in level walking. Nihon Seikeigeka Gakkai Zasshi 1985;59:985–97.
[2] Miyazaki M. [Role and movement of the toes during walking]. Nihon Seikeigeka Gakkai Zasshi 1993;67:606–16.
[3] Fanous J, Rice C. How Important is the Big Toe?: Functional Anatomy of Hallux Flexion. The FASEB Journal 2021;35. https://doi.org/10.1096/fasebj.2021.35.S1.01947.
[4] Mann RA, Hagy JL. The function of the toes in walking, jogging and running. Clin Orthop Relat Res 1979:24–9.
[5] Hall AL, Peterson CL, Kautz SA, Neptune RR. Relationships between muscle contributions to walking subtasks and functional walking status in persons with post-stroke hemiparesis. Clinical Biomechanics 2011;26:509–15. https://doi.org/10.1016/j.clinbiomech.2010.12.010.
[6] Suwa M, Imoto T, Kida A, Yokochi T. Early reduction in toe flexor strength is associated with physical activity in elderly men. J Phys Ther Sci 2016;28:1472–7. https://doi.org/10.1589/jpts.28.1472.
[7] First Ray. Physiopedia n.d. https://www.physio-pedia.com/First_Ray (accessed February 16, 2023).
[8] Nawoczenski DA, Baumhauer JF, Umberger BR. Relationship Between Clinical Measurements and Motion of the First Metatarsophalangeal Joint During Gait*. JBJS 1999;81:370.
[9] Green SM, Briggs PJ. Flexion strength of the toes in the normal foot. An evaluation using magnetic resonance imaging. The Foot 2013;23:115–9. https://doi.org/10.1016/j.foot.2013.07.001.
[10] Péter A, Hegyi A, Stenroth L, Finni T, Cronin NJ. EMG and force production of the flexor hallucis longus muscle in isometric plantarflexion and the push-off phase of walking. Journal of Biomechanics 2015;48:3413–9. https://doi.org/10.1016/j.jbiomech.2015.05.033.
[11] Kim CM, Eng JJ, Whittaker MW. Level walking and ambulatory capacity in persons with incomplete spinal cord injury: relationship with muscle strength. Spinal Cord 2004;42:156–62. https://doi.org/10.1038/sj.sc.3101569.
[12] Lee P-Y, Tsai Y-J, Liao Y-T, Yang Y-C, Lu F-H, Lin S-I. Reactive balance control in older adults with diabetes. Gait & Posture 2018;61:67–72.
[13] Uritani D, Fukumoto T, Matsumoto D, Shima M. The Relationship Between Toe Grip Strength and Dynamic Balance or Functional Mobility Among Community-Dwelling Japanese Older Adults: A Cross-Sectional Study. J Aging Phys Act 2016;24:459–64. https://doi.org/10.1123/japa.2015-0123.
[14] Zhang S, Li L. The differential effects of foot sole sensory on plantar pressure distribution between balance and gait. Gait & Posture 2013;37:532–5. https://doi.org/10.1016/j.gaitpost.2012.09.012.
[15] Beaudart C, Rolland Y, Cruz-Jentoft AJ, Bauer JM, Sieber C, Cooper C, et al. Assessment of Muscle Function and Physical Performance in Daily Clinical Practice. Calcif Tissue Int 2019;105:1–14. https://doi.org/10.1007/s00223-019-00545-w.
[16] Bohannon RW. Manual muscle testing: does it meet the standards of an adequate screening test? Clinical Rehabilitation 2005;19:662–7.
[17] Cuthbert SC, Goodheart GJ. On the reliability and validity of manual muscle testing: a literature review. Chiropractic & Osteopathy 2007;15:1–23.
[18] Davis PR, McKay MJ, Baldwin JN, Burns J, Pareyson D, Rose KJ. Repeatability, consistency, and accuracy of hand‐held dynamometry with and without fixation for measuring ankle plantarflexion strength in healthy adolescents and adults. Muscle & Nerve 2017;56:896–900.
[19] Spink MJ, Fotoohabadi MR, Menz HB. Foot and ankle strength assessment using hand-held dynamometry: reliability and age-related differences. Gerontology 2010;56:525–32.
[20] Bruening D, Ridge S, Jacobs J, Olsen M, Griffin D, Ferguson D, et al. Functional assessments of foot strength: a comparative and repeatability study. BMC Musculoskeletal Disorders 2019;20:608. https://doi.org/10.1186/s12891-019-2981-6.
[21] Harris-Love MO, Shrader JA, Davenport TE, Joe G, Rakocevic G, McElroy B, et al. Are Repeated Single-Limb Heel Raises and Manual Muscle Testing Associated With Peak Plantar-Flexor Force in People With Inclusion Body Myositis? Physical Therapy 2014;94:543–52. https://doi.org/10.2522/ptj.20130100.
[22] Ciesla N, Dinglas V, Fan E, Kho M, Kuramoto J, Needham D. Manual muscle testing: a method of measuring extremity muscle strength applied to critically ill patients. JoVE (Journal of Visualized Experiments) 2011:e2632.
[23] Wang H, Hile E, Ghazi M. Apparatus and method for measuring toe flexion and extension. US11402284B2, 2022.
[24] Trosclair D, Bellar D, Judge LW, Smith J, Mazerat N, Brignac A. Hand-Grip Strength as a Predictor of Muscular Strength and Endurance. The Journal of Strength & Conditioning Research 2011;25:S99. https://doi.org/10.1097/01.JSC.0000395736.42557.bc.
[25] Bohannon RW. Muscle strength: clinical and prognostic value of hand-grip dynamometry. Current Opinion in Clinical Nutrition & Metabolic Care 2015;18:465. https://doi.org/10.1097/MCO.0000000000000202.
[26] Dong R, Wang X, Guo Q, Wang J, Zhang W, Shen S, et al. Clinical Relevance of Different Handgrip Strength Indexes and Mobility Limitation in the Elderly Adults. The Journals of Gerontology: Series A 2016;71:96–102. https://doi.org/10.1093/gerona/glv168.
[27] Wiśniowska-Szurlej A, Ćwirlej-Sozańska A, Wołoszyn N, Sozański B, Wilmowska-Pietruszyńska A. Association between Handgrip Strength, Mobility, Leg Strength, Flexibility, and Postural Balance in Older Adults under Long-Term Care Facilities. BioMed Research International 2019;2019:1–9. https://doi.org/10.1155/2019/1042834.
[28] Marsh AP, Rejeski WJ, Espeland MA, Miller ME, Church TS, Fielding RA, et al. Muscle Strength and BMI as Predictors of Major Mobility Disability in the Lifestyle Interventions and Independence for Elders Pilot (LIFE-P). The Journals of Gerontology: Series A 2011;66A:1376–83. https://doi.org/10.1093/gerona/glr158.
[29] Sallinen J, Stenholm S, Rantanen T, Heliövaara M, Sainio P, Koskinen S. Hand-Grip Strength Cut Points to Screen Older Persons at Risk for Mobility Limitation. Journal of the American Geriatrics Society 2010;58:1721–6. https://doi.org/10.1111/j.1532-5415.2010.03035.x.
[30] Houston DK, Ding J, Nicklas BJ, Harris TB, Lee JS, Nevitt MC, et al. Overweight and Obesity Over the Adult Life Course and Incident Mobility Limitation in Older Adults: The Health, Aging and Body Composition Study. American Journal of Epidemiology 2009;169:927–36. https://doi.org/10.1093/aje/kwp007.
[31] Seino S, Kim M-J, Yabushita N, Matsuo T, Jung S, Nemoto M, et al. DISCRIMINATION OF MOBILITY LIMITATION BY HAND-GRIP STRENGTH AMONG COMMUNITY-DWELLING OLDER ADULTS. Japanese Journal of Physical Fitness and Sports Medicine 2011:259–68.